Influences of ENSO on seasonal and inter-annual sea level variability in the Cuban Archipelago.
Marcelino Hernández
Instituto de Oceanología, Ave 1 ra No. 18406 entre 184 y 186,
Rpto. Flores, Ciudad Habana, CP 12100 , Cuba
e-mail: ocean@oceano.inf.cu
Georgina Díaz
Geocuba Geodesia Independent Agency. Calle 4 No 302, entre 3ra y
3ra A. Miramar,Plaza, Havana City. Cuba
Abstract
The influence of ENSO on the seasonal and inter-annual variability of the components of mean and low sea level frequencies is analyzed, with special emphasis on the synoptic component, generated by atmospheric processes, starting from long hourly heights data series registered in five Cuban tide gauges. Numeric filters are applied to these data. The results obtained in previous researches are confirmed. New conclusions are added regarding qualitative and quantitative estimate of the extension of ENSO influence on sea level variability in the archipelago.
Key words: Sea-level, El Niño, ENSO, synoptic component, shallow waters, Gulf-of-Mexico, Cuban Archipelago, variance, monthly-mean-value, annual-mean-value.
Introduction
ENSO (El Niño – Southern Oscillation) generates sea level variations that are classified as low frequency atmospheric forcing (Chelton and Enfield, 1986) and constitutes a recurrent non-regular phenomenon that occurs at 2 to 5-year intervals. It is composed of two phenomena, one being El Niño, that consists in an unusual heating of the usually cold oceanic surface waters west of South America, and the other, the so called Southern Oscillation that occurs as a coherent inter-annual variation of barometric pressure (Enfield, 1992). These are two very synthesized definitions. ENSO effects and influences possess a global reach with different climatological evidences such as droughts and heavy rains.
Seasonal variability is defined as a random periodically correlation process. Its main probabilistic characteristics are mean value, variance and correlation function (Guerman and Levikov,1988). It almost always possesses an annual rhythm, although in some localities it presents a strong semi-annual component. Its main causes are the variability of the thermal structure of the ocean surface layer and the geostrophic circulation (Chelton and Enfield, 1986).
In the spectra of inter-annual variability, the components that result from changes in the parameters of ocean-atmosphere interaction and the effects of the restructuring of the ocean-atmosphere system processes are outstanding, with periods of 2 to 7 years. (Guerman and Levikov,1988).
Some works have been carried out on specific aspects of low-frequency sea level variability in the Cuban Archipelago and in the adjacent oceanic region. The present paper comments on those of more interest for its objectives.
A study was carried out on the variation of monthly mean sea levels through the year, with data from Siboney tide gauge, between l966 and 1985 (Díaz, G. 1983), where it was demonstrated that the annual cycle of this parameter is governed by the resultant conformed by the long period Annual Solar (Sa) and Semi-annual Solar (Ssa) tides. It could also determine (Díaz, G. y A. Montalvo, 1985) that the profile of this resultant varied its range from one year to another, depending on the amplitudes and phases reached by the harmonic components mentioned before. As general characteristic, it was established that minimum levels occur in the first three months of the year and the maximum levels in September or October. However, in the year 1983, when there was a strong ENSO event, this general pattern was affected and the maximum monthly mean sea level of the annual cycle moved toward June. This analysis was extended to other localities, within the framework of the elaboration of the New National Atlas of Cuba published in 1989 (Díaz, G. y A. Fariñas, 1989 in ICGC, 1989). A similar behavior was observed. It was also determined that the long period Sa and Ssa tides had relatively high amplitudes, being in occasions among the 5 highest harmonics. Blázquez (1989) demonstrated that the ENSO event, could influence sea level variations in our archipelago thanks to a mechanism of atmospheric tele-connection. The mentioned study shows how from November 1982 to October 1983 there was a synchronism of the positive sea level anomalies and the negative atmospheric pressure anomalies resulting in an increase of the first. In Hernández, M., J. Simanca and O. Ramírez (1990), Hernández, M. and J. Simanca (1997a), Hernández, M. and J.L. Ochoa (1997b), Hernández, M. (1998); and Hernández, M., O. Ramírez, J. Simanca and G. Díaz (1999) the behavior of the seasonal and inter-annual variability of the variance of the sea level synoptic component is analyzed with particular emphasis on Siboney locality, pointing out the influence of severe atmospheric processes and the ENSO on it.
The objectives of the present paper were to establish the influence scope of ENSO event in the Cuban archipelago, taking as starting point the precedent researches mentioned above, and to carry out a quantitative estimate of the said influence.
Materials and Methods
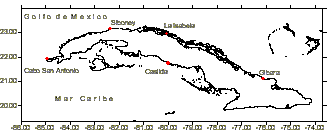
As primary information, it was used the sea level hourly heights
registered in five Cuban tide gauges (Fig. 1, Table 1).
Fig. 1: Geographical location of tide gauges.
Table 1: Geographical location of the used tide gauges and time series of sea level hourly heights.
| No. | Tide gauge | Latitude | Longitude | From | To |
| 1 | Siboney | 23 05.5 | 82 28.3 | 1966 | 1998 |
2 |
Cabo San Antonio |
21 54.4 |
84 54.4 |
1971 |
1998 |
3 |
La Isabela |
22 56.8 |
80 00.6 |
1972 |
1998 |
4 |
Gibara |
21 06.7 |
76 07.5 |
1971 |
1998 |
5 |
Casilda |
21 45.3 |
79 59.3 |
1972 |
1995 |
The mean daily value was calculated by means of Doodson's X0 filter (UNESCO, 1985) with the purpose of excluding the diurnal and semi-diurnal astronomical components that are not of interest for this work. As a result a value is obtained every 24 hours, centered in 12:00 M that in the present work we will conventionally call "Daily X0 Value" (hereafter DX0V). It is known that a series of daily mean values satisfactorily represents the sea level variability generated by atmospheric phenomena that occur in the synoptic interval of frequencies whose duration varies between 3 and 15 days according to the geographical region (Guerman and Levikov, 1988).
In the intervals with hourly heights data gaps, where the filter weights could not run, the corresponding DX0V were not calculated nor recovered by means of interpolation methods, since it was decided to obtain the monthly and annual variability as free as possible of values estimated using this type of procedures.
Monthly and annual mean values were only recovered in the case where the determination coefficient (r2) between the support series and the series with interruptions was greater than 0.90. After the corresponding tests, it could be established that only between Cabo San Antonio and Siboney the determination coefficient was greater than 0.90 when correlating the series of annual and monthly values.
Table 2. Results of the calculation of the correlation coefficients among series of annual and monthly mean values.
No. |
Pair of series | Mean annual values |
Mean monthly values |
||||||
N |
r |
Er |
r2 |
N |
r |
Er |
r2 |
||
1 |
Siboney - Cabo San Antonio | 16 |
0.949 |
± 0.016 |
0.902 |
269 |
0.949 |
± 0.004 |
0.901 |
2 |
Siboney - La Isabela | 15 |
0.691 |
± 0.091 |
0.478 |
263 |
0.8228 |
± 0.013 |
0.675 |
3 |
Siboney - Gibara | 22 |
0.780 |
± 0.056 |
0.609 |
286 |
0.799 |
± 0.014 |
0.639 |
4 |
Siboney- Casilda | 23 |
0.792 |
± 0.053 |
0.622 |
221 |
0.914 |
± 0.007 |
0.835 |
5 |
Cabo San Antonio – La Isabela | 24 |
0.729 |
± 0.067 |
0.531 |
227 |
0.872 |
± 0.011 |
0.760 |
6 |
Cabo San Antonio – Gibara | 24 |
0.920 |
± 0.022 |
0.846 |
245 |
0.845 |
± 0.012 |
0.714 |
7 |
Cabo San Antonio - Casilda | 22 |
0.782 |
± 0.056 |
0.611 |
185 |
0.915 |
± 0.008 |
0.837 |
8 |
La Isabela - Gibara | 12 |
0.646 |
± 0.113 |
0.418 |
240 |
0.8187 |
± 0.014 |
0.670 |
9 |
La Isabela - Casilda | 20 |
0.502 |
± 0.113 |
0.252 |
185 |
0.902 |
± 0.009 |
0.814 |
10 |
Gibara - Casilda | 21 |
0.733 |
± 0.068 |
0.537 |
186 |
0.858 |
± 0.013 |
0.736 |
The probable error of the correlation coefficient was calculated by means of the following expression:
The mean annual values of Cabo San Antonio were reestablished by means of the equation of lineal regression y=0.8455x-14.374 with the support of the Siboney series.
For Casilda tide gauge, it was necessary to carry out an adjustment of the mean annual and monthly values, since between 1981 and 1983 there was a change of the benchmark from –95 to –163, and there are no measurements in 1982. The adjustment consisted in subtracting 68 cm (163-95=68) to the values from 1983 on, and adding a correction that was obtained by averaging the differences among the mean annual and monthly values of Cabo San Antonio and Casilda tide gauges, before and after 1982, according to the procedure applied by Hernández and Rodas in Victoria, I., M. Hernández, L. Rodas, J. Simanca and A. Cabal (1990).
Results and Discussion
The variability of the mean monthly sea level value is similar in the five localities studied (Figs. 2a and 2b) and most of the times its highest values took place in September and October. Only in some cases they were observed in other months of the annual cycle, as it happened in Siboney, from 1980 to 1983, when the maximum mean monthly value was alternated among the months of May, June and July; and in 1992 that it took place in June (Fig. 2c), altering the pattern of the annual cycle. Something similar occurred in Cabo San Antonio, La Isabela and Gibara. Although in Casilda this phenomenon could not be proven in the '80s, due to the DX0V data gaps, it occurred in 1992, with a maximum mean monthly value in June. The lowest monthly mean values were generally observed in the first trimester of the annual cycle. Therefore, it is confirmed with a greater volume of data the influence of ENSO on the inter-annual sea level variability pattern already described by the previously mentioned authors.
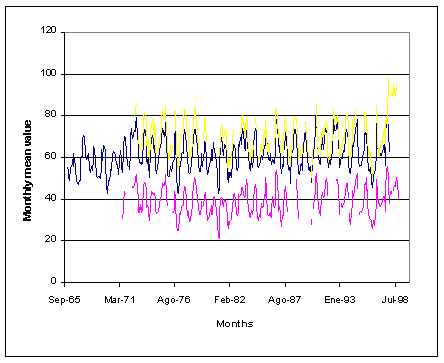
Fig. 2a: Variability of monthly mean value at Siboney (blue), Cabo San Antonio (fucsia) and La Isabela (yellow).
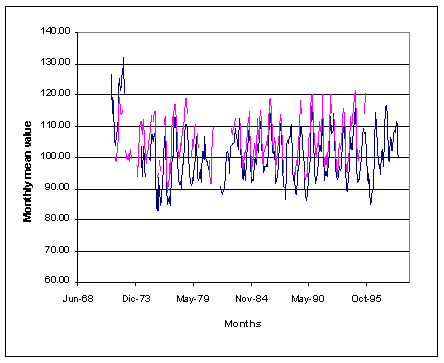
Fig. 2b: Variability of monthly mean value at Gibara (blue) and Casilda (fucsia).
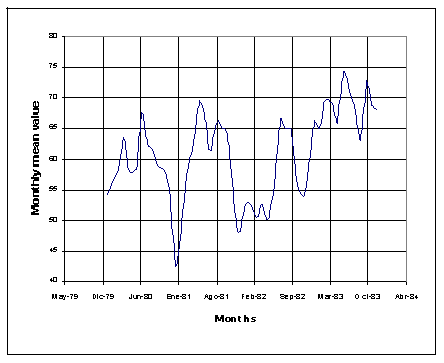
Fig. 2c: Variability of monthly mean value from January 1980 to December 1983 at Siboney.
Therefore, the regional extension of this phenomenon to the whole
archipelago is demonstrated with a greater data volume, although
it is not reflected in the annual cycle of mean sea level value
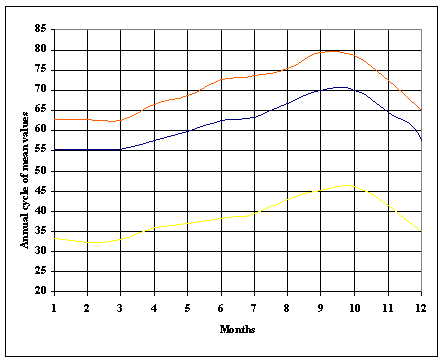
(Figures 3a and 3b) where the historical monthly mean value is
higher, on average, in September and October and lower in the
first three months of the year.
Fig. 3a: Annual cycle of monthly mean DX0V values at Siboney (blue), Cabo San Antonio (yellow) and La Isabela (red).
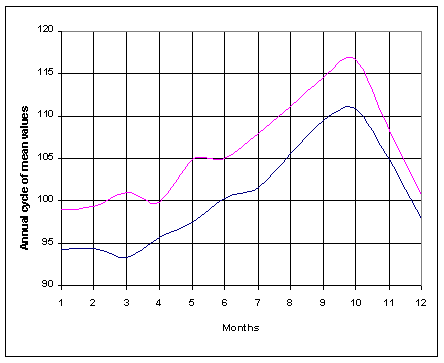
Fig. 3b: Annual cycle of monthly mean DX0V values at Gibara (blue) and Casilda (fucsia).
The correlation coefficient calculation among the monthly variability of the different localities (Table 2) showed that it is in general very high, reflecting the great regional character of the processes that govern the variability and that the connection among each of the tide gauges is fundamentally atmospheric in this temporary scale, particularly between Siboney and Cabo San Antonio that practically receive the influence of the same atmospheric phenomena mainly generated in the Gulf of Mexico or in the continent. The existence of a high correlation also between Casilda locality and Siboney, Cabo San Antonio and La Isabela is due to the fact the majority of the most intense atmospheric phenomena, mainly cold fronts and extra-tropical storms, move in the NW–SE direction and almost always affect to a greater extent the western part of the archipelago, and Gibara locality is farther from this scenario, with a more Atlantic climatological influence.
In the graphic of the monthly variability of the DX0V variance in Siboney (Fig. 4a) two periods can be appreciated: the first between 1966 and beginnings of the '80s and the second from there to the present. During the '60s and '70s, the variance stayed evenly higher in the months of the first and fourth trimesters of the annual cycle and evenly lower during the rest of the year. However, since the beginnings of the '80s, exactly starting from March 1983, extraordinarily high values begin to appear, almost always in the first and fourth trimesters, except for April 1988, being very frequent the very high values in the February and March. The highest values, between 70 and more than 120 cm2 corresponded in this order to February 1992, January 1987, November 1985, March 1983 and 1996, and October 1987. During these months, severe atmospheric phenomena of the synoptic frequency scale took place, causing sufficiently intense interference so as to reflect their influence on the monthly variability. Surprisingly, March 1993 appears with a moderately high value. Prior to 1983, the DX0V variance values were neither so frequent nor so high in January, February and March as after that year.
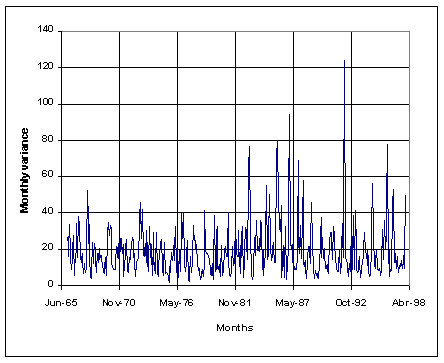
Fig. 4a: Variability of DX0V monthly variance at Siboney from 1966 to 1997.
In Cabo San Antonio, La Isabela, Gibara and Casilda (Fig. 4b), it is not observed a defined division of the monthly variability series of variance in two parts as in Siboney; but in general, starting from beginnings of the '80s, there appear relatively higher values of the monthly DX0V variance. In these localities, sea level measurements are made under physical-geographical conditions of more shallowness and isolation from oceanic influence. Thus, sea level response to hydrometeorological processes of synoptic scale is somehow different from that in Siboney. Most of the highest values in the analyzed parameter took place in the years of ENSO occurrence, mainly in Siboney, which should be related with the well-known intensification of the influence of certain severe atmospheric phenomena during the ENSO years, as it happens to the extra-tropical storms that tend to be located more to the south (Moreno, A. , R. Pérez, G. Omar, P. Miguel, I. Salas, I. Mitrani, R. Casals, A. Pérez, C. Rodríguez, J. Peguero, J. Guerra, M. Hernández, J. Simanca, J. Batista y M. Sánchez (1997). In Smith (1979), the author demonstrated the existence of a greater variability, between January and April than between April and July, of the differences of atmospheric pressure among distant and opposed localities of the Gulf of Mexico. Smith's paper was devoted to the study of the inverse barometer effect at local scale and of the influence of the atmospheric pressure fluctuations on the propagation at distance of sea level mean frequency signals, factors that should be part of the ocean-atmosphere tele-connection mechanism under the ENSO climatological conditions. It is not perceived yet whether the increment of the monthly average intensity of the synoptic component variations is part of a cycle or it obeys to a tendency forced by the Climatic Change.
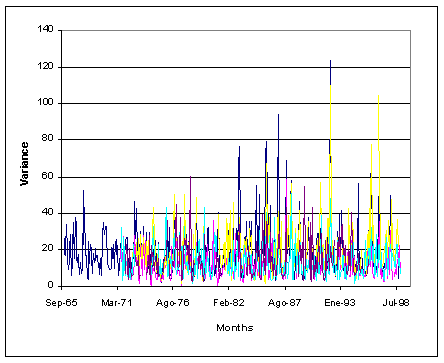
Fig. 4b: Variability of DX0V monthly variance at Siboney (dark blue), Cabo San Antonio (fucsia), La Isabela (yellow), Gibara (light blue) and Casilda (brown).
The annual cycle of the DX0V variance (Fig. 5) represents the average seasonality of sea level variation intensity in the synoptic interval of frequencies. In general, in the five tide gauges studied, variance value is higher in the months of the first and fourth trimesters of the annual cycle, mainly in Siboney and Cabo San Antonio, since the other three are farther from the Gulf of Mexico and receive a lower influence of the phenomena generating the sea level synoptic component, the cold fronts and extra-tropical storms, that occur with greater frequency in the mentioned period of time (New National Atlas of Cuba, 1989). We should also mention the strong winds of southern component that also affect the western half of the archipelago, from September to May (Rodríguez and Ballester, 1985). This way it is confirmed the existence of a seasonal pattern of greater variability of the synoptic component (Hernández and Simanca, 1990 and 1997a; Hernández and Ochoa, 1997b) during the months of higher frequency of intense atmospheric phenomena, and its existence is demonstrated for the whole archipelago.
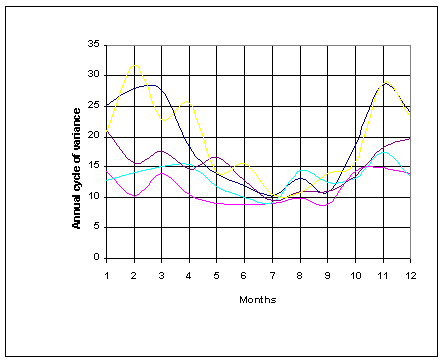
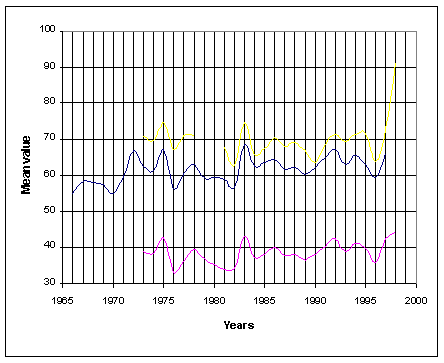
Fig. 5: Annual cycle of DX0V variance in the five localities studied: Siboney (dark blue), Cabo San Antonio (fucsia), La Isabela (yellow), Gibara (light blue) and Casilda (brown).
Fig. 6a: Inter-annual variability of DX0V mean values in Siboney (blue), Cabo San Antonio (fucsia) and La Isabela (yellow).
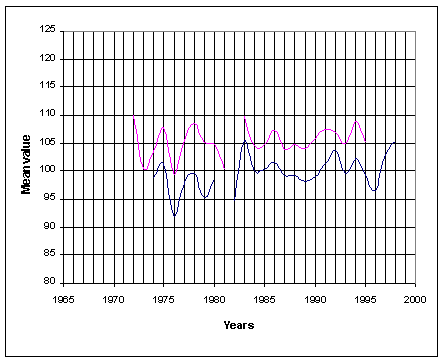
Fig. 6b: Inter-annual variability of DX0V mean values in Gibara (blue) and Casilda (fucsia).
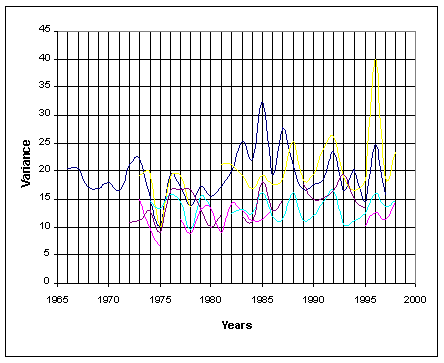
Fig. 7: Inter-annual variability of the DX0V variance in the five localities studied: Siboney (dark blue), Cabo San Antonio (fucsia), La Isabela (yellow), Gibara (light blue) and Casilda (brown).
The mean annual values (Fig. 6a and 6b) of the five tide gauges analyzed present common features that reveal the existence of regional processes that connect the inter-annual variability of the different localities. As it is appreciated in Table 2, the lineal correlation among the Cuban tide gauges is high in most of the cases, with r values that fluctuate between 0.502 and more than 0.949. The highest value, 0.94, was obtained when correlating Siboney and Cabo San Antonio. In comparison, the inter-annual variability of La Isabela possesses a low correlation with the other localities that can be attributed to its location in an area of shallow bottoms with a partially limited exchange with the ocean, which creates different conditions for the sea level response to climatological factors. In almost every ENSO year, there were increments of this parameter in all the analyzed localities, with a great synchronism, mainly in 1983.
The inter-annual variability of the variance (Fig. 7) represents the annual average intensity of the DX0V variations. As it can be observed, there were increments of the inter-annual variability of the variance in Siboney in every year of occurrence of ENSO event, being also appreciated a great synchronism of this parameter in all the localities analyzed. It is also visible the lower inter-annual variability of the variance in the period previous to 1983, more marked in Siboney.
Conclusions
It was confirmed, with a greater amount of information from different localities of the Cuban archipelago, the regional character of phenomena previously studied at a local scale:
- ENSO influence on the seasonal and inter-annual sea level variability, specifically regarding the variability of the synoptic component.
- The occurrence of alterations of the seasonal sea level variability pattern during the ENSO.
- The occurrence of more intense variations of the sea level synoptic component during the first and fourth trimesters of the annual cycle.
- The prevalence of the influence of extra-tropical storms on the sea level synoptic component in Siboney tide gauge in the occurrence of extreme variations.
It was proven the existence of a close correlation of the monthly and inter-annual variability among all the localities of the western and central regions of the archipelago that receive a greater influence of the atmospheric phenomena mainly coming from the Gulf of Mexico.
According to our results and to the conditions of the location of Siboney tide gauge, we can state that it is the atmospheric pressure variability the parameter that exercises greater influence on the variability of the synoptic component in that locality.
Acknowledgements
We thank the National Program of Global Changes and Evolution of the Cuban Environment, and the directions of the Institute of Oceanology and of Geocuba Geodesia Independent Agency, for offering us the framework and necessary support to carry out this work. We also thank the work and collaboration of the technicians Adrián Niévares Pérez and Raudel García Santos in the primary processing of the information. We especially express our grateful appreciation to Martha María Rivero for the translation and edition of this paper.
Bibliography